Introduction
Monitoring your PC’s performance is essential for identifying and resolving issues that hinder its efficiency. Bottlenecks occur when one component limits the overall performance, resulting in lag, stuttering, or reduced productivity. This guide provides practical steps to monitor your PC’s performance and identify bottlenecks effectively.
Monitoring your PC’s performance is crucial to ensure optimal functionality and to identify any potential issues that may arise. For a comprehensive understanding of PC bottlenecks and strategies to prevent them, refer to our Ultimate Guide to PC Bottlenecks and How to Avoid Them.
Using Task Manager for Basic Monitoring
The Task Manager is a built-in Windows tool offering a quick system performance overview.
Steps:
- Open Task Manager: Press
Ctrl + Shift + Escor right-click the taskbar and select Task Manager. - Navigate to the Performance Tab: Click the Performance tab to view real-time CPU, memory, disk, and network usage.
- Analyze Resource Usage: Look for components consistently near 100% utilization. This indicates potential bottlenecks.
- Check Processes: Switch to the Processes tab to identify resource-hungry applications.
Tip: Use Task Manager for quick assessments, but for detailed insights, consider advanced tools like MSI Afterburner or HWiNFO.
Using MSI Afterburner for Advanced Monitoring
For detailed insights, third-party tools like MSI Afterburner provide comprehensive monitoring data.
Steps:
- Download and Install MSI Afterburner: Visit the official MSI Afterburner site and download the tool. Install it along with RivaTuner Statistics Server for overlay functionality.
- Configure Monitoring Settings:
- Open MSI Afterburner and go to Settings.
- Under the Monitoring tab, select parameters to track (e.g., CPU temperature, GPU usage, FPS, Frame Time).
- Essential Parameters: GPU Usage, GPU Temperature, CPU Usage (per core), CPU Temperature (per core), RAM Usage, Frame Rate (FPS), Frame Time.
- Enable “Show in On-Screen Display” for real-time overlays.
- Run the Tool While Using Your PC: Launch a resource-intensive application or game to test performance under load.
- Observe the On-Screen Overlay: Monitor detailed performance metrics.
- Save Logs for Further Analysis: Enable logging to track performance data over time.
Tip: Customize the overlay settings to display only the metrics you need for better clarity during testing.
Utilizing the right tools can provide insights into your system’s performance and help identify bottlenecks. Explore various tools tailored for specific scenarios in our guide on Bottleneck Calculators for Specific Use Cases.
Interpreting Performance Data
Understanding the collected data is crucial for identifying bottlenecks.
CPU Utilization
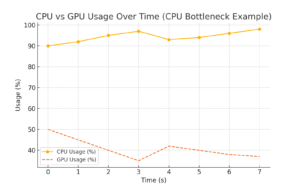
- High CPU usage (>90%) for extended periods indicates a CPU bottleneck.
- In gaming, high CPU usage with low GPU usage suggests the CPU is limiting the GPU.

CPU vs GPU Usage Chart: Demonstrates a CPU bottleneck scenario.
GPU Utilization
- Consistent GPU utilization near 100% in games or graphically intensive applications indicates a GPU bottleneck.
- If GPU usage is low while CPU usage is also low, other factors like VSync or frame rate limiters might be in effect.
Memory (RAM) Utilization
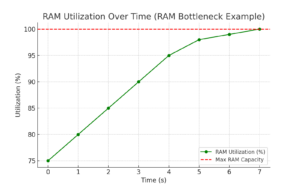
- RAM usage consistently near or at 100% forces the system to use the hard drive as virtual memory, causing significant performance degradation and stuttering.

RAM Utilization Graph: Shows RAM usage nearing 100%, indicating a bottleneck.
Disk Utilization
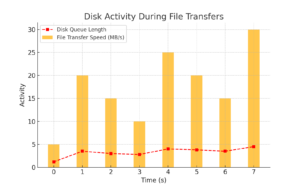
- High disk usage, especially on HDDs, can lead to slow loading times, sluggish file transfers, and overall system unresponsiveness. SSDs mitigate this.

Disk Activity Graph: Illustrates disk performance during file transfers.
Note: For advanced disk performance metrics, use Windows Resource Monitor or tools like CrystalDiskInfo.
Identifying Bottleneck Symptoms from Performance Data
Once you’ve gathered performance data, look for these common bottleneck indicators:
| Symptom | Potential Bottleneck |
|---|---|
| Lag or Freezing | CPU or RAM |
| Low FPS in Games | GPU or insufficient VRAM |
| Slow File Transfers | Disk (HDD) |
| High Network Latency | Network Connection |
Solutions to Common Bottlenecks
| Component | Solution |
|---|---|
| CPU | Overclocking (if possible), upgrading the CPU |
| GPU | Upgrading the GPU, lowering graphics settings |
| RAM | Adding more RAM |
| Disk | Upgrading to an SSD (NVMe if possible) |
Tip: Consider upgrading components based on the specific bottleneck symptoms observed.
Conclusion
Regular performance monitoring helps maintain your PC’s efficiency and prolongs its lifespan. Start with basic tools like Task Manager for quick checks, and move to advanced tools like MSI Afterburner for detailed analysis. By interpreting performance data and identifying bottlenecks, you can optimize your system for better performance. Make performance monitoring a routine practice to ensure your PC runs smoothly.
Pro Tip: Regularly update your drivers and ensure your system is free of malware to avoid false bottleneck readings.